
Reports and analytics
The five report tabs in GVenta Help Desk, date presets, shared filters, SLA compliance panels, response-time buckets, and CSV export that matches the screen.
Documented from GVenta Help Desk version 1.8.55.
Reports at https://your-instance.example/reports show how your support operation is performing: volumes, response and resolution times, SLA compliance, and who and what is generating the load. Every chart, table and export respects the same date range and filters.
Who can see reports
Reports are available to the Super Admin, Agent and Viewer roles. Other roles see an explicit “Access Restricted” panel rather than a broken page. See Roles and access control.
Controls shared by every tab
Date range
Choose a preset or a custom range. Last 30 Days is the default.
- Today
- Yesterday
- Last 7 Days
- Last 30 Days (default)
- This Month
- Last Month
- This Quarter
- Last Quarter
- Year to Date
- Last 12 Months
- Custom From/To range
Filters
Five cross-cutting filters apply consistently to every chart, table and export on every tab:
| Filter | Narrows results to |
|---|---|
| Status | Tickets in the chosen status. |
| Priority | Tickets at the chosen priority. |
| Source | Tickets from a chosen mailbox or channel label. |
| Agent | Tickets assigned to a chosen agent. |
| Customer | Tickets for a chosen company. |
Export and print
Export to CSV downloads the current report as a spreadsheet-friendly file. The export applies exactly the same date range and filters as the report on screen, so the download always matches what you were looking at. Print produces a printable version of the page.
Why it matters: Prove your SLA performance, find your busiest customers and your bottlenecks, and hand a board-ready CSV to whoever asks, filtered exactly the way you were looking at it.
Overview tab
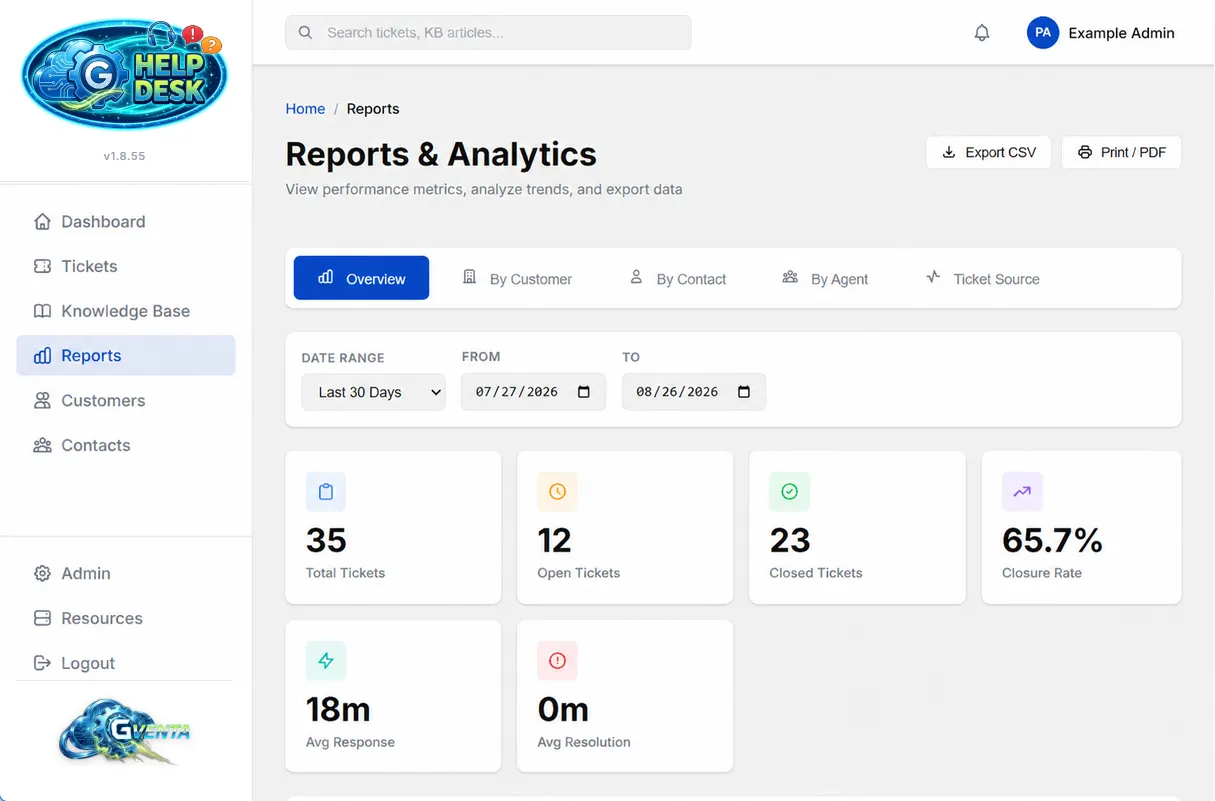 The Overview tab: summary cards for the selected range, with CSV export and print.
The Overview tab is the summary of the whole period.
Summary cards
Six cards: Total Tickets, Open Tickets, Closed Tickets, Closure Rate, Average Response, Average Resolution.
Charts
- Ticket volume trend over the selected period.
- Status distribution and priority distribution doughnut charts.
- Source distribution, showing which mailbox or channel tickets came from.
SLA compliance panels
Two panels, one for resolution SLA and one for first-response SLA. Each shows the total number of tickets measured, how many met their target, how many breached it, and a compliance percentage.
Compliance is calculated by comparing each ticket’s stored business-hours deadline against the time it was actually resolved or first answered. Tickets that are still open but have already passed their deadline are counted as breached, so the panel never flatters you by ignoring work that is late and unfinished. How deadlines are set is explained in SLA engine; the targets and business hours are configured under Settings.
Response-time distribution
First responses are bucketed into five bands so you can see the shape of your responsiveness, not just the average:
| Bucket |
|---|
| Under 1 hour |
| 1 to 4 hours |
| 4 to 8 hours |
| 8 to 24 hours |
| Over 24 hours |
Agents tab
- A leaderboard of agent performance.
- A workload distribution chart showing how tickets are spread across the team.
- A detailed per-agent table.
Customers tab
- A top customers chart.
- A full customer table with ticket volumes per company.
Contacts tab
- A top contacts chart.
- A contact-level table showing which individual people generate the most support load, which is often more actionable than the company view.
Sources tab
- A source volume chart.
- A source trend over time chart.
- A source breakdown table.
Sources include both inbound mailboxes and channel labels reported through the API or the client portal. See Core concepts for how the source vocabulary is maintained.
Performance and freshness
Reports are designed to stay fast on large ticket histories.
- Purpose-built indexes. The ticket data is indexed specifically for the combinations reports ask for (status, agent, customer, priority and source over time, plus resolution, first-response and SLA timestamps), so analytics do not slow down as the dataset grows.
- Five-minute cache. Each report result is cached for 300 seconds, keyed by the report and the exact combination of date range and filters. Re-running the same view within that window is served instantly. A different filter combination is a different cache entry, so you never see another filter’s numbers. If the cache is ever unavailable, the report simply runs live rather than failing.
- Stored deadlines. Because SLA deadlines are stored on each ticket when it is created, compliance is a simple comparison rather than a calendar calculation repeated for every ticket in the range.
Emailed digests
If you would rather have the Overview delivered than look it up, a Super Admin can enable a weekly digest (sent on Mondays) and a monthly digest (sent on the 1st of the month) under Settings, SLA & Reports. Each digest carries an HTML summary and a CSV attachment and goes to a configurable recipient list. A separate Daily Report notification is configured under Settings, Notifications. See Settings and administration and Background jobs.
Related pages
- API reference for the report endpoints, including the filter-options endpoint for building your own filter controls and the CSV export endpoint.
- Dashboard for today’s snapshot rather than trends over time.